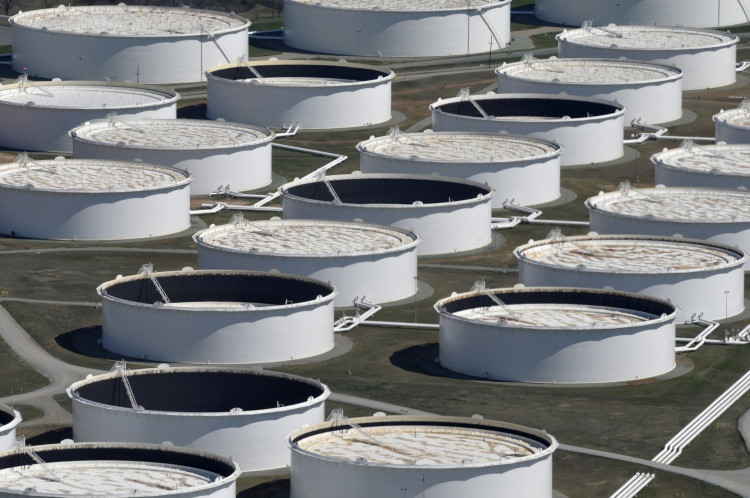
Following last Tuesday's Eastern time trading, the American Petroleum Institute (API) announced that U.S. crude oil inventories had plummeted by 15.4 million barrels over the previous week. This marked the largest weekly drop on record, far surpassing analysts' expected decrease of 1.3 million barrels.
Inventories of U.S. gasoline and refined oil also exceeded analysts' expectations last week. Gasoline inventories fell by 1.68 million barrels, exceeding the projected drop of 1.3 million barrels. Refined oil inventories decreased by 512,000 barrels, surpassing the expected reduction of 100,000 barrels.
If Wednesday's data from the U.S. Energy Information Administration (EIA), a division of the Department of Energy, also shows a decrease of 15.4 million barrels in crude oil inventory last week, it will establish the largest single-week decline since records began in 1982.
Following the release of the API data, U.S. WTI crude oil futures, which had closed approximately 0.5% lower on Tuesday, jumped sharply from around $81.6 before the data release to over $82.
WTI crude oil has climbed back to its highest point within this year. If it maintains this upward momentum through Wednesday's close, it could exceed the three-month high established on Monday.
After Saudi Arabia and Russia both announced new supply reduction measures in the first week of July, international crude oil futures continued to rally week after week. As of last week, oil prices had risen for five consecutive weeks. As of Monday, oil closed at its highest in over three months for three consecutive trading days.
The market widely believes that repeated production cuts by OPEC+, including Saudi Arabia and Russia, are the primary cause of rising oil prices. Senior market analyst in oil and energy, John Jemp, believes that a short-covering trend induced by OPEC+'s production cuts is also fueling this oil price hike.
Data from the CFTC and ICE European Futures Exchange show that in the seven days leading up to July 25, hedge funds and other fund managers bought an oil equivalent of 52 million barrels across six major oil futures and options contracts.
From June 27 to July 25, fund managers collectively bought 229 million barrels of oil, 169 million barrels of which were contracts tied to crude oil, particularly NYMEX and ICE WTI contracts, totaling 132 million barrels.
Among NYMEX and ICE WTI contracts, the reduction in short positions amounted to an equivalent of 104 million barrels, and the increase in long positions equated to 65 million barrels.
Jemp pointed out that on June 27, the price of the near-month futures of U.S. WTI crude oil was still less than $68 per barrel. Due to the short-covering push, it reached over $81 per barrel on Tuesday, August 1, showing a nearly 20% increase within five weeks.
As of July 25, the combined positions of WTI and Brent crude oil increased to 374 million barrels, surpassing 76% of the levels for each week since 2013, and marking an over 82% rise from the historic low of 205 million barrels set on June 27.
Over the four weeks leading up to July 25, the rapid increase in European diesel futures and options positions was particularly noteworthy, with an increase of 29 million barrels. Net positions went from 12 million barrels on June 27 to 41 million barrels on July 25.
In general, over the past six to nine months, despite signs of industrial recession in North America and Europe, inventories remain below normal levels. Consequently, fund managers are becoming increasingly optimistic about fuel prices. If the economy achieves a soft landing and then resumes expansion, growth in fuel consumption could quickly lead to supply constraints.
Despite U.S. natural gas inventories continuing to exceed long-term averages, investors are becoming increasingly bullish on U.S. natural gas. In the seven days leading up to July 25, hedge funds and other fund managers bought futures and options contracts for U.S. natural gas equivalent to 176 billion cubic feet.
By July 25, the net long position for U.S. natural gas had risen to 7.23 trillion cubic feet, above 53% of levels for each week since 2010. This was a stark contrast to the net short position of 1.061 trillion cubic feet on January 31, which was above 93% of levels since 2010.