To now become part of the richest of the rich in the USA -- or the much-maligned "1%" -- a wealthy American must earn $1.32 million a year at the very least. In contrast, the median household income in the U.S. was $59,039 in 2016.
According to the Economic Policy Institute (EPI) in its latest income inequality report, the average annual income of the top 1% today is an astounding $1,316,985 compared to $1,111,491 five years ago. More incredibly, this compares to an average income of just over $50,000 for the bottom 99%
To be included in the top 1% in the USA, a family needs a minimum monthly income of $421,926. Five years ago, this amount stood at $358,780.
The EPI report confirms that the top 1% of income earners in America are truly getting richer and richer at the expense of the average American worker. In the 1970s, the top 1% accounted for less than 10% of all the income earned in this country. In recent years, however, they've accumulated more than 20% of all income.
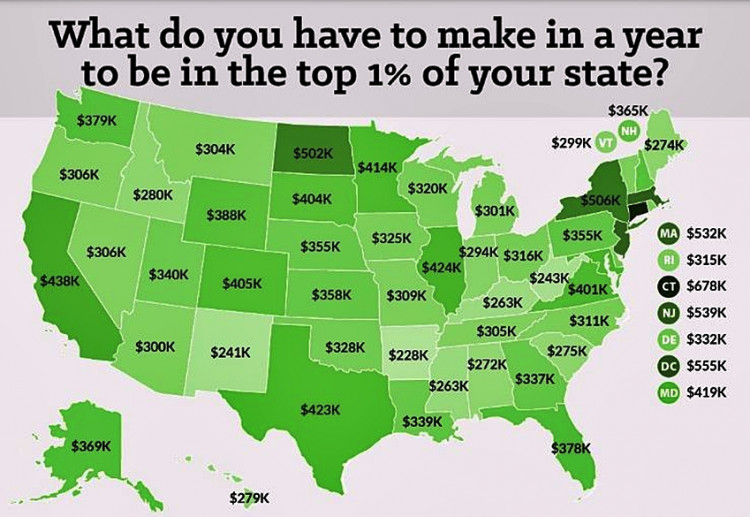
Some states are richer than others when it comes to the entry level standard for inclusion in the 1%. A rich family in Connecticut had to earn a minimum household income of $700,800 to be part of the state's top 1%. For the rich in the District of Columbia, the entry level is $598,155. In New Jersey, it's $588,575; in Massachusetts, $582,774); in New York $550,174 and in California, $514,694.
Then there's Colorado $458,576; Illinois $456,377; Washington $451,395; Maryland $445,783 and North Dakota $445,415.
"The dollar amounts of the top one percent threshold can vary sharply from one locale to another," said the EPI report. "A community in which the threshold is less than $100,000 clearly looks different from a community with a threshold greater than $2 millio -- it means something very different to be in the top 1 percent in Liberty County, Georgia, versus Teton County, Wyoming."
Based in Washington, D.C., EPI is a non-partisan think tank that "seeks to include the needs of low- and middle-income workers in economic policy discussions."
The top 10 states with the highest annual incomes among the 1% are: New York $2,202,480; Florida $1,543,124; Connecticut, $2,522,806; Nevada $1,354,780; Wyoming $1,900,659; Massachusetts $1,904,805; California $1,693,094; Illinois $1,412,024; New Jersey $1,581,829 and Washington $1,383,223.
Huge salaries and perks for CEOs and other C-Suite executives plays a key role in driving-up the requirements for entry into the 1%, says EPI. EPI data shows that CEOs in America's largest companies made an average of $15.6 million in 2016. That's 271 times what the average worker made -- and is an unconscionable inequality gap that must be greatly reduced.
And some CEOs are making a lot more than their peers. The highest-paid CEOS in 2016 included Thomas Rutledge of Charter Communications, who was paid $98 million; Leslie Moonves of CBS with $68.6 million and Robert Iger of Disney who made $41 million. EPI believes CEOs are getting paid a lot more "because of their power to set pay, not because they are more productive or have special talent or have more education."
Other experts agree. "CEO pay, in my view, has been one of the main drivers of the escalation of income of the top 1% and the top 0.1%," said economist Lawrence Mishel.
This massive income divide is still "light years beyond" the 20-to-1 ratio in 1965 and the 59-to-1 ratio in 1989, said the EPI report.