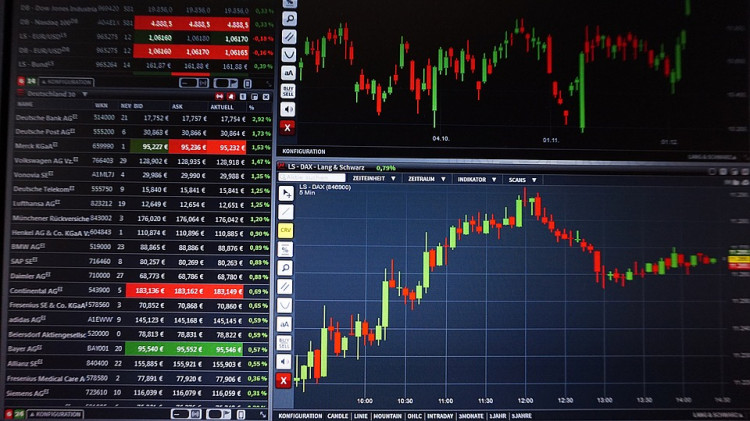
The importance of understanding the numbers behind trading cannot be stressed enough when you are starting out as a forex trader.
This theoretical knowledge can be used to underpin all the buy and sell positions you action, and the indicators provide time served insights that take you from being a 'guesswork' based speculator to a quantitative investor.
So what are the different types of forex indicators that you can use, and which should you adopt in your trading?
Aroon indicator
One of the most popular groups of technical tools to use in forex trading is the oscillator, and the Aroon Indicator offers essential insight into the strength of a trend.
The Aroon Forex Indicator has both 'up' and 'down' indicators to help identify the strength of a trend and its momentum, with peaks or valleys displayed on the chart to showcase overbought or oversold positions.
While you can find the Aroon Indicator on many of the leading trading platforms like MetaTrader, you can calculate your own formula by following these steps:
- Picking a number of periods
- Calculating Aroon 'up': 100 * ((N - number of periods since high)/N)
- Calculating Aroon 'down': 100 * ((N - number of periods since low)/N)
These calculations will reflect the trending shift of a forex pair and is commonly used to determine if a long-term trend has ended or is experiencing a temporary halt before new highs/lows are tested.
ADX indicator
The ADX Indicator, or Average Directional Movement Index to give its full name, is a tool for understanding the strength of a trending force - be it upwards or downwards.
Particularly useful in learning whether a trend will experience a continuation or lose its power, many traders use ADX as a mechanism for plotting their forex entry and exit points.
A type of oscillator, the ADX can be plotted using your chosen trading software, with a value of between 0 and 100 offered. In essence, a figure below 20 reveals a weak trend and over 40 a strong pattern, with the line calculating the strength of the directional movement.
Some of the more interesting ADX calculations are those where there's a movement of 20 points higher or lower than a previous mark, which indicates a strong trending move. Traders should also be wary of crossover points, particularly those marked by an upward trend.
Bollinger Bands indicator
One of the most used technical indicators, the Bollinger Bands measure enables traders to compare price high and lows with market volatility, offering an insight into why a trend is happening, rather than merely identifying a pattern quantitatively.
The Bollinger Indicator can be used to predict changes in volatility, and that, in turn, will offer a guide as to whether trend changes are on the horizon via the moving average.
Widely available in most trading software packages, the Bollinger Bands Indicator gets its name from the shape that the lines form, with contracting or expanding bands detailing the current and potentially future state of play.
The upper limit band is an indicator of resistance, while the lower limit band represents support, and so traders can get a simplistic visual on how an asset is valued at any given time.
Many utilize Bollinger Bands in their individual trading strategies, although the universal trends of 'hug' or 'squeeze' - essentially when the bands hit support or resistance - are the foundation for success when using this indicator.
Exponential Moving Average indicator
For those who trade using candlestick charts, the Exponential Moving Average (EMA) adds extra contextualization with a line overlaid on top.
This line displays a change of price behavior over a given period of time, and the main perk of the EMA is that it can reveal price changes instantly - when a market changes, so too does the EMA, and there's no lagging effect which can take hold with other indicators.
The downside of being so reactive is that the Exponential Moving Average can create 'false' signals when there are inconsistent spikes in volume, but as an indicator of support or resistance that is dynamic many traders trust the EMA to deliver the insight they need.
For traders just getting started with indicators and technical tools, the EMA is an excellent guide as it represents complex information with a simple visual concept.
To advance the insights gained, traders can plot two EMAs against one another with different timeframe inputs. Where the two lines intersect, this can be considered a very useful signal that identifies buy or sell conditions.


